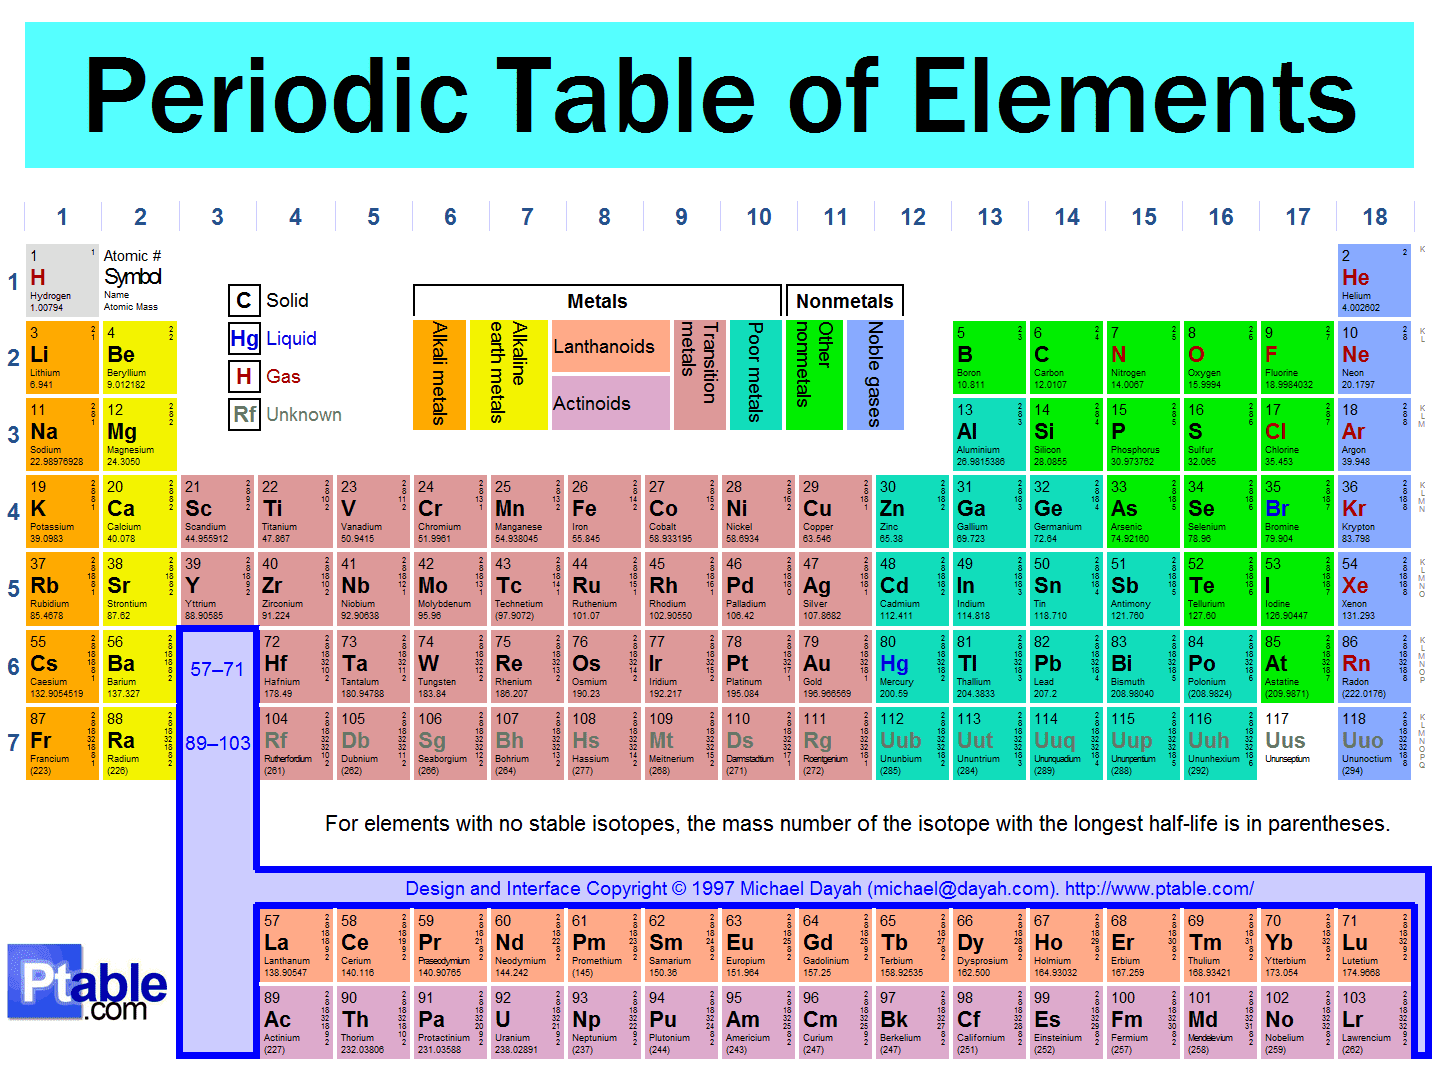
Tuesday 25 June 2013

Week 4

Decision making and research on the decision!


What is element?
Element is a pure substance consisting one type of atom. Some of these chemical elements are not visible to human eyes. They are divided into metals and non-metals.

What data is chosen for the assignment?
Non-metals which divided into other non-metals, noble gases and halogens.
These other non-metals are HYDROGEN, CARBON, NITROGEN and, OXYGEN.
So i googled up the boiling point for each of these non-metals.
Boiling point:-
Hydrogen -252.9°C
Carbon 4827°C
Nitrogen -195.8°C
Oxygen -183.°C

Why do i choose to do periodic table of element?
Because everything in this world is made up elements.

Why those data are chosen as my assignment?
It is the most common to me and the people so the time to explain what kind of elements they are is not raised by people. Therefore the interaction can be done easier without much doubt.

How to visualise?
I was thinking of using colors and lines.
I will be using BASIC COLOURS in art studies since elements are the basic components. Those colours are RED, BLUE, YELLOW and BLACK. Why these colours? These colours made up to many other colours. So it is perfect metaphor.
It will be shown on paper. ART on A3 paper!

Carbon (Black)
Nitrogen (Yellow)
Oxygen (Blue)
Hydrogern (Red)

Why the colours are assigned this way?
Following the rainbow arrangement, Red will be first then Yellow then Blue. Black is not existed in rainbow colour. Why? Why rainbow arrangement? Because according to which colour to appear upon our eyes, it is first Red, then Yellow, then Blue and the last will be Black. So it is according to the Boiling Points of each elements. It will be Hydrogen first, then Nitrogen, then Oxygen and then Black.

Source:
Element
Chemical element

Tuesday 18 June 2013

Week 2 Decision making!

Decision making!

Periodic Table of Elements.

What is it?


Awesome web presentation!

It is extensive and it has interactive feature.

http://www.ptable.com/


Friday 14 June 2013

Week 2 (addidtion)

More on Research

Visualisation.

I googled up image on visualisation and see tons of nice artworks.

Creative visualisation is a technique to portray an event or behavior of real life with own creativity. Therefore it is supposed to not be directly of the event or behavior.

Google Image

Google Image

Google Image

Google Image

Google Image

Google Image

Google Image

Google Image

Google Image


And as usual wikipedia being the most informative web. It lists down the type of visualisation.
Reference:
Visualization
Creative Visualisation


Week 2

Brief:
Assignment 01

Mark of 50% [20% process; 30% final]
Process:


Research: 8% and
Idea development process: 12%
Final:
Overall concept and creativity: 10%
Project execution and interactivity: 15%
Concept board: 5% 


Submission Week6 [10th July 2013]
Interactive application consisting statistical data.

HIGHLIGHT!
submission for week 3:- 


Research

What is statistical data?
-Numerical data. It must consist of numbers of statistic.

Usually the statistic will be sum up into visualisation for easy useability and understandability.
Either it will be in the pie chart, bar graph, line graph or flow chart.

Traditional/ Standard visualisation of statistic value.

Standard statistic values are usually present in clean and summarize manner of numerical data.
Usually, this type of presentation will be use in the professional line of field.
 
Google Image


Google Image


Google Image


Google Image

Creative visualisation of statistic value.

Google Image


Google Image


Google Image


Google Image

Creative visualisation of statistical data is fun and refreshing.
If it is design properly, it may be use in the professional line of work to present data collected.


When i googled up statistical data, these links are the top in search engine:

Statistics
Statistical Data Warehouse
National Bureau of Statistics of China
Statistics Worldwide
WHO
Data and Statistics
National Statistical AgenciesDepartment of Statistics Malaysia